
Did you know that in 2023, we generated an estimated 120 zettabytes of data, and this is projected to reach 180 zettabytes by 2025? For businesses today, the real challenge is to comprehend this vast data, extract valuable, actionable insights, and communicate these insights effectively to stakeholders. This blog talks about the art of data visualization and storytelling, explores how tools like Microsoft Power BI and YellowFin BI can aid in automating data visualization, and examines future trends in automated data storytelling.
Comprehending Big Data and Extracting Actionable Insights
Big data comprises structured and unstructured data, about 90% unstructured, flowing in from various sources like social media, transactional systems, and IoT devices. To comprehend this data and extract actionable insights, enterprises need to:

At Celestial Systems, our Data and Analytics services help enterprises navigate the complexities of big data. Our solutions ensure that your data is collected, processed and analyzed efficiently to deliver meaningful insights that drive strategic and predictive business decisions.
How Can We Help?
Enhancing Data Storytelling Through Data Visualization
Data visualization is the graphical depiction of information and data. By using visual elements like charts, graphs, and maps, data visualization tools provide an accessible way to see and understand trends, outliers, and patterns in data. Here’s how visualization enhances data storytelling:
- Clarity and Understanding: Visual representations make complex data more understandable and accessible. Stakeholders can grasp insights quickly without needing to dive deep into raw data.
- Engagement: Visual stories are more engaging than spreadsheets or reports. They can capture attention and keep the audience engaged.
- Retention: Visually displayed information is more likely to be retained by the audience.
Here are some pointers that might help:
- Select visuals that best represent your data, such as bar charts for comparisons or line graphs for trends.
- Simplify visuals with clear titles and labels, minimizing distractions.
- Use consistent color schemes and highlight key data points.
- Present data with a clear narrative structure, including a beginning, middle, and end.
- Incorporate interactive elements like filters and tooltips for deeper exploration.
- Make use of Annotations to highlight and clarify key findings.
According to the internet, when companies utilize data visualization, they’re 5x more likely to speed up their decision-making process and 3x more likely to follow through with those decisions. What’s more, managers have a 28% higher chance of finding timely information using visual data recovery tools. It’s interesting to note that nearly half of them, or 48%, don’t require IT support when accessing the data they need for their work.
Automating Data Visualization with Microsoft Power BI and YellowFin BI
Manual data visualization procedures tend to be time-consuming, prone to errors, and obstruct quick decision-making. Automation is key to keeping up with the rapid influx of data and resolving challenges around overwhelming data volumes, time-to-insight, data quality and consistency, and scalability with minimal human intervention.
By setting up automated workflows, companies can free up analysts’ time to focus on deeper insights rather than data preparation. Microsoft Power BI and YellowFin BI are two leading tools in this space.
Microsoft Power BI:
- Integration: Power BI integrates with multipledata sources for seamless data aggregation.
- Interactive Dashboards: Users can create interactive dashboards that update in real-time, providing up-to-date insights.
- Customization: Power BI offers customizable visuals and reports, enabling tailored data storytelling.
YellowFin BI:
- Data Discovery: YellowFin BI provides robust data discovery capabilities, helping users find the stories hidden within their data.
- Automated Reporting: The platform can generate reports automatically, reducing manual report creation time.
- Collaboration: YellowFin BI supports enable teams to share insights and collaborate on data analysis.
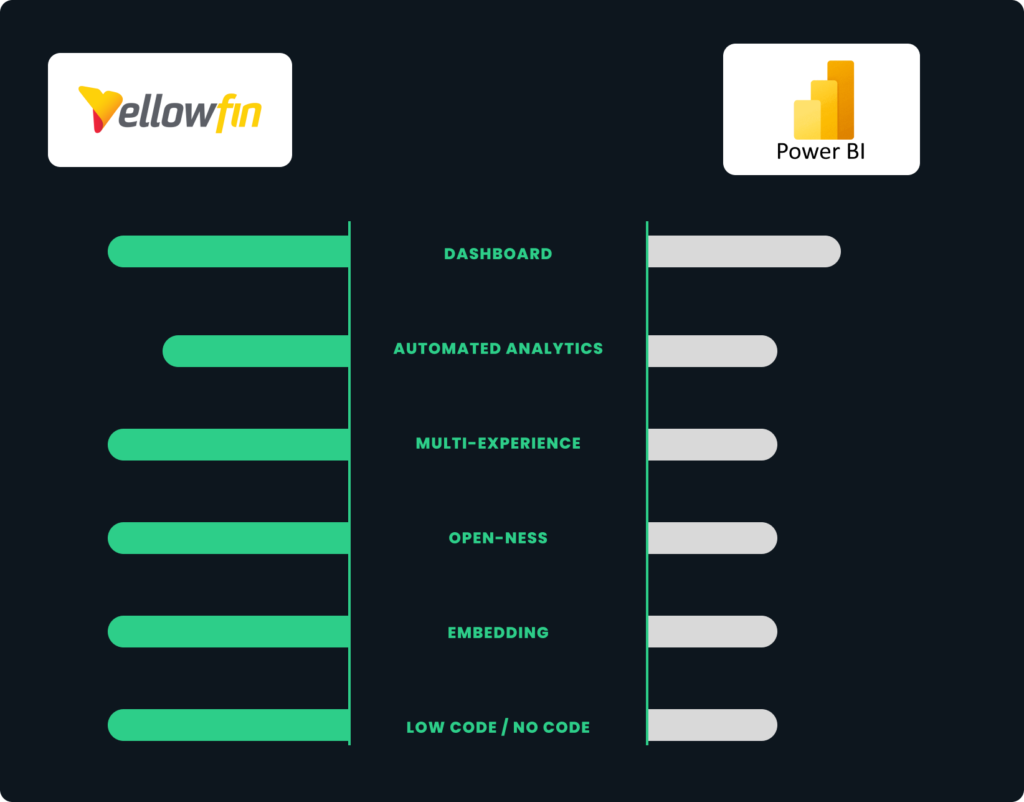
Source: YellowFin
Automating Data Storytelling with AI, Machine Learning, and Natural Language Processing
The intersection of AI, machine learning, and natural language processing is revolutionizing data storytelling. Businesses can extract maximum value from their information assets by automating the process of transforming raw data into stories. This approach involves:
- AI and Machine Learning: AI & ML use vast datasets to identify trends and provide insights.
- Natural Language Generation (NLG): NLG converts data insights into textual explanations, making it easier for stakeholders to understand the implications of the data.
- Integration: AI-driven tools can integrate with visualization platforms to provide a seamless transition from data analysis to storytelling.
Automated data storytelling can provide consistent, unbiased insights quickly and at scale, allowing organizations to make data-driven decisions faster. Our Application Modernization and Product Engineering services leverage these advanced technologies to transform your applications and enhance their data storytelling capabilities.
Future Trends in Data Visualization and Storytelling
As we look ahead to 2025 and beyond, several trends are expected to shape data visualization and storytelling for enterprises:
- Augmented Analytics: Combining AI and machine learning with human intelligence to provide deeper insights and more accurate predictions.
- Personalization: Tailoring visualizations and stories to the needs of individual users or teams in an organization.
- Real-Time Data Visualization: With a growing demand for real-time data, we can expect advancements in tools that can instantly handle and visualize data.
- Enhanced Collaboration: Future tools will prioritize collaborative features, allowing teams to work together seamlessly, no matter where they are.
- Advanced Natural Language Processing: Improvements in NLP will make automated storytelling more sophisticated, providing narratives that are indistinguishable from those written by humans.
Conclusion
At Celestial Systems, our comprehensive solutions in Data and Analytics and Application Modernization and Product Engineering are designed to help adapt to these shifts and lead the way in innovation.
Contact us today to help turn your “Big Data into Big Insights”!