A Real-time, Insightful Employee Skill Data Visualization
Comprehensive monitoring and performance analysis Monitoring performance of transactions and business-critical processes
Industry : Finance, Data Analytics
Services Offered
UI/UX Consulting
DevOps
App Development
Overview
In today’s era of Big Data, data visualization is a critical tool for solving “analyzing paralysis” in our hyper-competitive business world. Assessing and analysing data graphically cuts down the time spent in recognizing many correlated parameters and patterns that were not visible before but are still influencing your business. Visualization transforms your data into actionable intelligence for you to make informed decisions.
The Client
The most important asset in any organization is its people. SkillNet provides a platform to measure skills and power upskilling programs for a wide range of enterprises across the globe. SkillNet configures detailed skill assessments to provide a talent inventory that displays individual and organizational capabilities and gaps. This data is generally not available in HR platforms so most firms trying to build a skill database typically use Microsoft Excel. SkillNet goes further to automate personal development plans using the assessment data. This approach improves employee performance and engagement.
Dissecting Problem
1
Business Requirement
SkillNet was asked to expand data visualization for a large client seeking to analyze staff capabilities and remove manager bias
Build a real time graphical visualization of employee skillset data to organize upskilling programs
A benchmarking tool based on various assessment filters to normalize data across managers, regions and business units
Integrating these capabilities to leverage the data they were already collecting
Celestial’s Solution
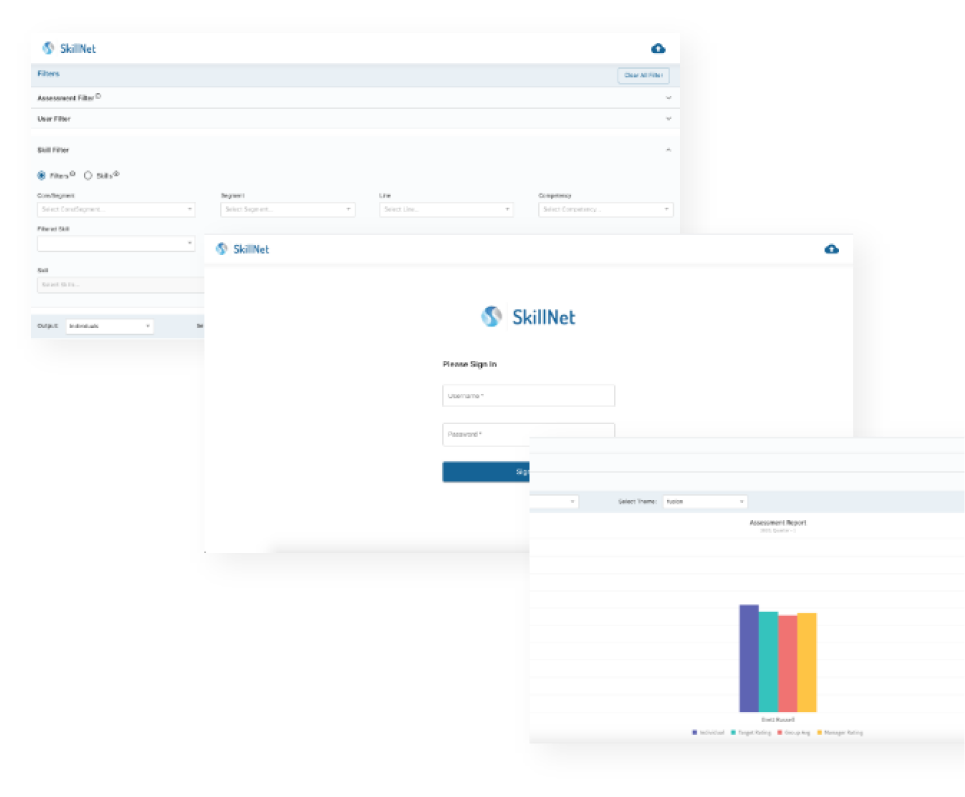
Celestial’s enterprise solution to meet the above requirements was built on Lattice, our in-house ReactJS framework. The use of the Lattice ReactJS framework allowed us to meet the “end requirement” of SkillNet – enhance their current tool to create a standard platform to evaluate over 200 employees being evaluated on 300 skill sets. Furthermore, the platform we built can be plugged into their existing system. The critical data visualization component was designed using FusionCharts which consumes the employees’ data and ratings and generates customizable graphic outputs for the same. Advanced and intuitive filters were developed to help users make employee assessments and develop targeted up-skill programs. The data visualization viewer can also filter results based on the designation of employee role, respective managers, and location of work – as well as being able to make comparisons across all of these parameters.
ASSESSMENT FILTER
This feature provides options for both self-assessment and for the managers to evaluate their team
USER FILTER
Allows selection of the user types – users belonging to different roles/teams/categories/locations
SKILL FILTER
Facilitates filtering based on skills ratings and assessments
Technology Used :
Outcomes
80% enhanced employee performance for SkillNet clients
80% increased efficiency of employee upskilling programs
70% improvement in data analysis
80% increase in overall business proficiency for SkillNet
Easy integration to existing tools
Generic platform for graphical comparison of efficiency